Introduction to R

Karthik Ram

karthik.ram+R@gmail.com

M to see all slides, G to go to a specific slide

Download a copy


R is a language that's easy to learn badly

Why R?

The old way...

Why R?

A better way


glm(y ~ -1 + a + c + z + a:z, data = mydata, maxit = 30)


This is reproducible, repeatable and will make sense to you (and everyone else) further down the line.

Choose an appropriate code editor

  1. R Studio

    rstudio
  1. TinnR (Windows), Sublime Text (all), Text Wrangler (osx) etc.

    All come with key bindings. Pick one that you like.

    I heart Sublime Text

Establish a workflow


A workflow (best suited to you) will help keep your analysis streamlined and reproducible.

A sample workflow


load.r
	

load all raw untransformed data.


clean.r

Transform and clean messy data incl. missing values.


functions.r

Keep all functions in one separate file.


do.r

Your actual analysis. Load cleaned data and source all functions.


# File: do.r source("functions.r") load("cleaned_data.rdata")


Avoid restoring workspaces

Workflow...

Set working directores from the console and not scripts

# My_script.r setwd("path/to/dir") # Removing any extra objects from my workspace (just in case) rm(list = ls()) # Keeps my current file clutter free source("related_r_scripts.r")

Workflow...

Never attach data

attach(mydata)

Always refer to it explicitly

mydata$column_name

Environments and Namespaces

Global Environment

a <- rnorm(100)
     
Function or Namespace

a <- 5

Annotate your code clearly

Good ✔
# Script to analyze rainfall data. # loading lib: plyr_1.7.1, devtools_0.6, ggplot2_0.9.0 library(stringr) library(ggplot2) library(plyr) # reading previously cleaned data load("data_files.rdata") # Sourcing functions source("functions.r") # Setting up parameters annual_mean <- 25 # mean value is in cm
     
Bad ✖
library(ggplot2) foo <- read.csv("file1.csv") a <- 1 b <- 3 test <- function(foo2) { return(a + b) }

Quick guide to R data types

# Vector: (single dimension, all same type) vec1 <- 1:10 class(vec1)
## [1] "integer"
vec2 <- letters[1:10] class(vec2)
## [1] "character" # Data Frame: Each column is a vector, but adjacent vectors can hold different things # Matrix: Just like a data.frame except it's all numeric # List: (any dimension, mix and match)
l1 <- list(A = data.frame(x = 1:10, y = rnorm(10)), B = 1, C = letters[1:3]) str(l1)
## List of 3 $ A:'data.frame': 10 obs. of 2 variables: ..$ x: int [1:10] 1 2 3 4 5 6 7 8 9 10 ..$ y: num [1:10] 0.618 0.519 0.343 0.428 -0.885 ... $ B: num 1 $ C: chr [1:3] "a" "b" "c"

Finding Help

Locally


		?function_name
		??function_name
		RSiteSearch("function_name")
	

Online

StackOverflow.com/questions/tagged/r Rseek.org

sessionInfo()

sessionInfo()
## R version 2.14.2 (2012-02-29) Platform: x86_64-apple-darwin9.8.0/x86_64 (64-bit) locale: [1] en_US.UTF-8/en_US.UTF-8/en_US.UTF-8/C/en_US.UTF-8/en_US.UTF-8 attached base packages: [1] graphics grDevices utils datasets stats methods base other attached packages: [1] knitr_0.3 formatR_0.3-4 devtools_0.6 plyr_1.7.1 [5] reshape2_1.2.1 ggplot2_0.9.0 loaded via a namespace (and not attached): [1] codetools_0.2-8 colorspace_1.1-1 dichromat_1.2-4 [4] digest_0.5.1 evaluate_0.4.1 gdata_2.8.2 [7] grid_2.14.2 gtools_2.6.2 highlight_0.3.1 [10] MASS_7.3-17 memoise_0.1 munsell_0.3 [13] parser_0.0-14 proto_0.3-9.2 RColorBrewer_1.0-5 [16] Rcpp_0.9.10 RCurl_1.91-1 scales_0.2.0 [19] stringr_0.6 tools_2.14.2

Use dput() to share some data

dput(head(mtcars))
structure(list(mpg = c(21, 21, 22.8, 21.4, 18.7, 18.1), cyl = c(6, 6, 4, 6, 8, 6), disp = c(160, 160, 108, 258, 360, 225), hp = c(110, 110, 93, 110, 175, 105), drat = c(3.9, 3.9, 3.85, 3.08, 3.15, 2.76), wt = c(2.62, 2.875, 2.32, 3.215, 3.44, 3.46), qsec = c(16.46, 17.02, 18.61, 19.44, 17.02, 20.22), vs = c(0, 0, 1, 1, 0, 1), am = c(1, 1, 1, 0, 0, 0), gear = c(4, 4, 4, 3, 3, 3), carb = c(4, 4, 1, 1, 2, 1)), .Names = c("mpg", "cyl", "disp", "hp", "drat", "wt", "qsec", "vs", "am", "gear", "carb"), row.names = c("Mazda RX4", "Mazda RX4 Wag", "Datsun 710", "Hornet 4 Drive", "Hornet Sportabout", "Valiant"), class = "data.frame")
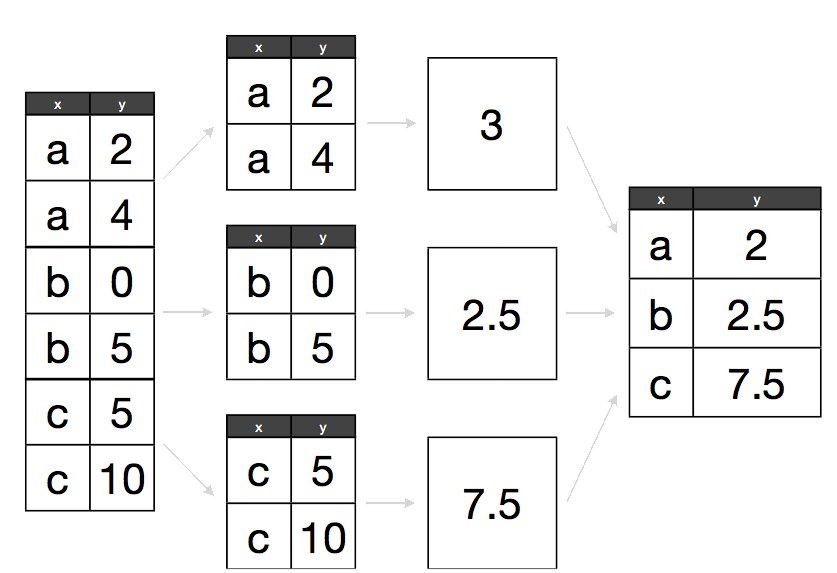
Leverage your .rprofile

Set options

options(max.print = 2000) options(prompt = "$ ") options(stringsAsFactors = FALSE) # Store API keys options(MendeleyKey = "My_secret_key")

	See ?options for more information on settings
	options() to list current settings

Leverage your .rprofile

Load frequently used libraries

library(ggplot2) library(stringr) library(plyr) library(devtools)

Leverage your .rprofile

Load custom functions

# A function that tells me which packages are out of date check.packages <- function() { if (!is.null(utils::old.packages())) { old_packages <- utils::old.packages() cat("Notification:", dim(old_packages)[1], "packages are out of date \n") cat(unname(old_packages[, 1]), sep = ",", "\n") } if (is.null(utils::old.packages())) { cat("All packages are current \n") } }

Word of caution regarding.rprofile

While the .rprofile does make life convenient, remember that any code/settings stored there are not reproducible by others.

Be sure to test your code without loading the file before sharing/deploying code.


# To load R without the .rprofile R -- vanilla


Thanks to Hadley for pointing this out oversight.

Reading Data

from flat text files

read.table

from databases

Use packages RODBC, RMySQL

from cloud storage

Amazon S3, Google Docs, Dropbox etc.

Saving Data

Short-term
save(data, file = "slots.rdata")
Long-term
write.table(data, file = "slots-3.csv", sep = ",", row = F)

Manipulating Data - Plyr

The Split-Apply strategy The Split-Apply Strategy slide from Hadley Wickham

Hadley Wickham (2011). The Split-Apply-Combine Strategy for Data Analysis. JSS, 40(1), 1-29. for more details

ddply example


data <- data.frame(x = c("a", "a", "b", "b", "c", "c"), y = c(2, 4, 0, 5, 5, 10))
ddply(data, .(x), summarise, y = mean(y))

Plyr syntax


Function naming scheme: first letter of source R object + first letter of output R object + ply

result <- ddply(data, variable, summarise, n = sum(n))
result <- llply(list_name, function_name)

reshape2 allows you to reshape data into any format possible

dcast(melted_data, temp ~ light, length)
dcast(melted_data, temp ~ light, mean)
dcast(melted_data, temp ~ light, custom_function)

Example of melting and casting

test_data <- data.frame(id = 1:9, category = factor(rep(sample(letters[1:3]), 3)), treatment = rep(sample(c("control", "trt_1", "trt_2")), 3), price_index = rnorm(9) * 200, prev_yr_index = rnorm(9) * 200)
melted_data <- melt(test_data, id.vars = 1:3)
dcast(melted_data, category + treatment ~ variable, length) dcast(melted_data, category + treatment ~ variable, mean)

Writing Functions

If you have to repeat the same 3-4 lines of code more than once, turn it into a function

Use a version control system like git

Cover of Jon Loeliger's book

Dynamic report generation


	# As easy as:
	knit('report.rnw')
	
# All the syntax in this talk was generated using knitr

R on the cloud


R scales really well on cloud platforms (AWS, most anything)

Amazon web services

R can interact with any web service that has an API

Make function calls to R using REST API


opencpu.org

Open CPU

Questions?

/

#